3D solar design in under 10 minutes
Design customer-ready rooftop systems with AI. SolarVis runs hourly simulation and bankable shading analysis, cutting design time by up to 80% without specialized design expertise.
Every project type, every grid connection
Residential rooftops, commercial and industrial sites, and agricultural irrigation are designed in the same workflow, on-grid, off-grid, or with zero injection. The connection type carries through to tariff logic, export rules, and the proposal that comes out.
- Residential
- Commercial and industrial
- Agricultural irrigation
- On-grid
- Off-grid
- Zero injection
Trusted by















From roof sketch to string-optimized design in one browser tab
No CAD software. No plugin installs. Everything runs in the browser with real specs, real electrical validation, and real-time shading analysis.
- 01
Roof drawing and 3D modeling
Let AI detect the roof from satellite imagery, then lift it into 3D with Fit to LiDAR, or draw the outline yourself on multiple satellite map layers, including a high-resolution one. Define slopes per face, add obstacles and dormers. The 3D model builds from elevation data or from the slopes you set.
- 02
AI panel placement and inverter
Let AI design the layout for you: set a target panel count, annual production, installed capacity in kWp, or share of consumption, pick maximum efficiency or maximum production, and choose portrait, landscape, or mixed module orientation. Panels fill in automatically while respecting setbacks, obstacles, and shading, or place them by hand. Inverter auto-suggest matches your DC capacity, or select manually from the database.
- 03
String design
Wire panels into series strings, assign them to MPPT inputs, and validate Voc, Vmpp, and Isc against inverter limits in real time with temperature-dependent checks. The finished stringing generates the single line diagram.
- 04
4-in-1 system sizing
PV, battery storage, heat pump, and EV charger modeled together on an 8760-hour consumption curve, built from monthly entries, a 24-hour load shape, appliance-level modeling, or an hourly Excel template. Each component affects system sizing and downstream feasibility math.
- 05
Bankable feasibility report
Generate a technical feasibility report straight from the 3D design: yield, irradiation, Performance Ratio, probabilistic P50/P90/P99 production, system specs, and performance, ready for bank and customer review.
Panels, inverters, batteries, and heat pumps in the database carry real specs (dimensions, power, capacity) and are sized against real electrical limits. Your layouts respect physical dimensions and electrical limits, not placeholder rectangles.
Six capabilities that replace separate tools
Detect a roof with AI, or draw any roof in minutes
Start with AI roof detection that reads satellite imagery and returns the roof outline, inner edges, and faces in seconds, then let Fit to LiDAR set height and slope from high-resolution elevation data, or assign the slopes yourself. Multiple map providers, custom uploads when satellite data falls short, and snapping tools built for irregular shapes keep the drawing step short on every project.
- AI roof detection from satellite imagery, Fit to LiDAR for height and slope
- Multiple map providers, including high-resolution imagery
- Polygon snapping with alignment guides
- Inner edge detection for complex roofs
- Custom satellite imagery upload
- Obstacles and dormers with height adjustment
- DXF import and export, with a built-in CAD viewer
- Roof sections at their own height and roof type, for stepped and multi-level roofs
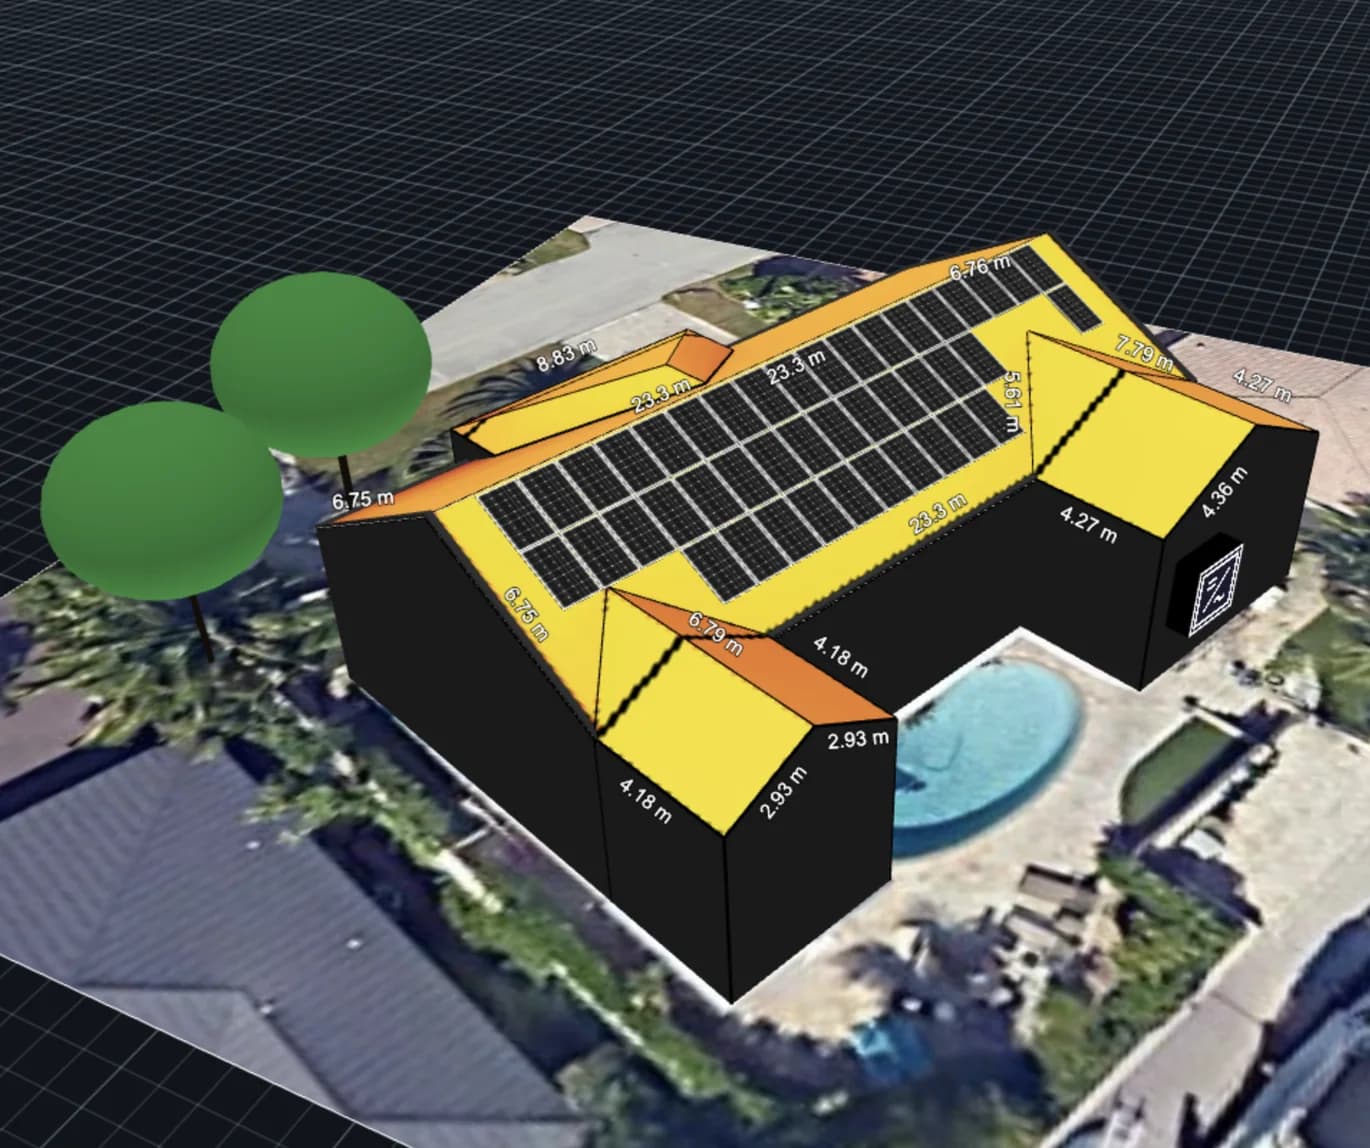
Let the app design the layout, then fine-tune every panel by hand
Pick a goal, a panel count, an annual production target, an installed capacity in kWp, or a share of the customer's consumption, choose maximum efficiency or maximum production, and the layout fills in automatically across every suitable roof face while respecting setbacks, obstacles, dormers, and shading. On flat roofs it produces construction-ready layouts with service corridors, wind edge zones, and east-west tables, and when panels already exist you choose whether to keep and fill around them or replace them outright.
- Goal-based auto-layout by panel count, production target, installed kWp, or consumption share
- Maximum production, or maximum efficiency with a 75% minimum TSRF threshold
- Flat-roof layouts with service corridors, wind edge zones, and east-west tables
- Prune slider to raise the TSRF threshold and trim the weakest panels after placement
- Portrait, landscape, or mixed orientation, with skip north-facing and easy construction options
- Manual drag-to-place, grouping, duplication, and a per-panel shading inspector with Sun Path
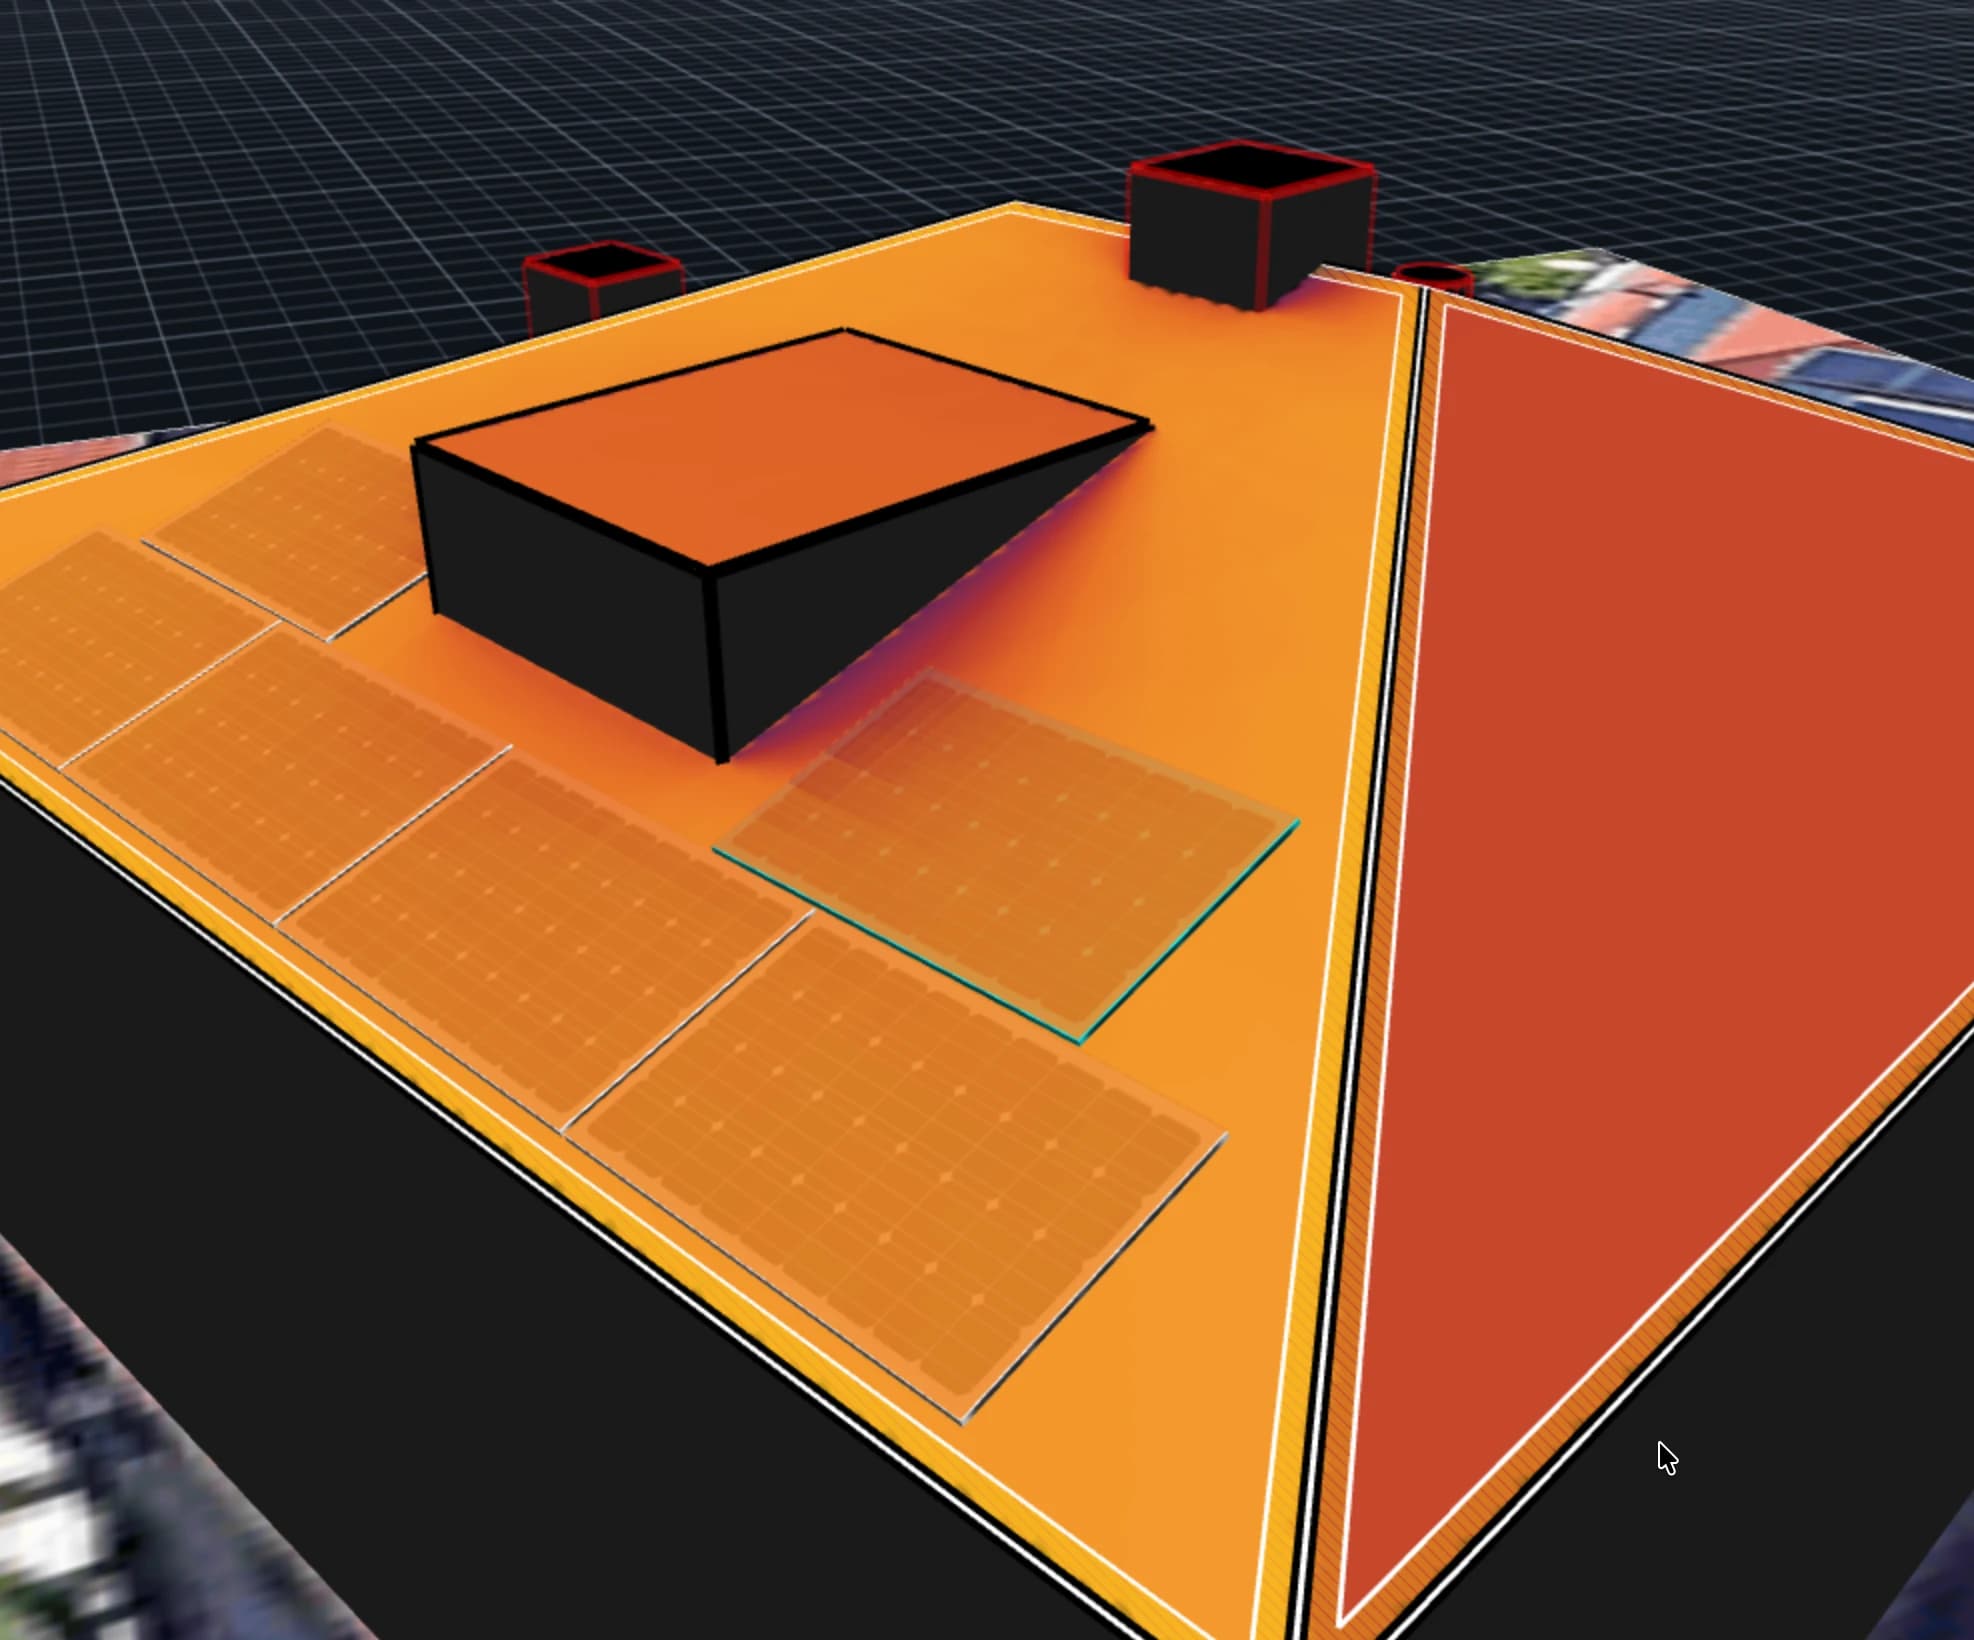
See exactly which panels lose production before you sell the system
Know exactly which panels will earn their keep before the customer signs. Hour-by-hour shading runs against the full 3D model, so a tree at the back of the lot or a chimney on the wrong slope shows up in the production estimate, not in a service call months later.
- In-house simulation engine, with PVGIS weather data for a specific year or a Typical Meteorological Year
- Hourly shading resolved per cell and per bypass-diode group, from trees, obstacles, and dormers
- Color-coded solar irradiance visualization
- Annual yield per panel with Performance Ratio and P50/P90/P99 confidence levels
- Downloadable PDF shade report with per-array shading and sun access, or as a proposal section
- Export the 8760-hour simulation to Excel: consumption, heat pump load, and PV generation, hour by hour
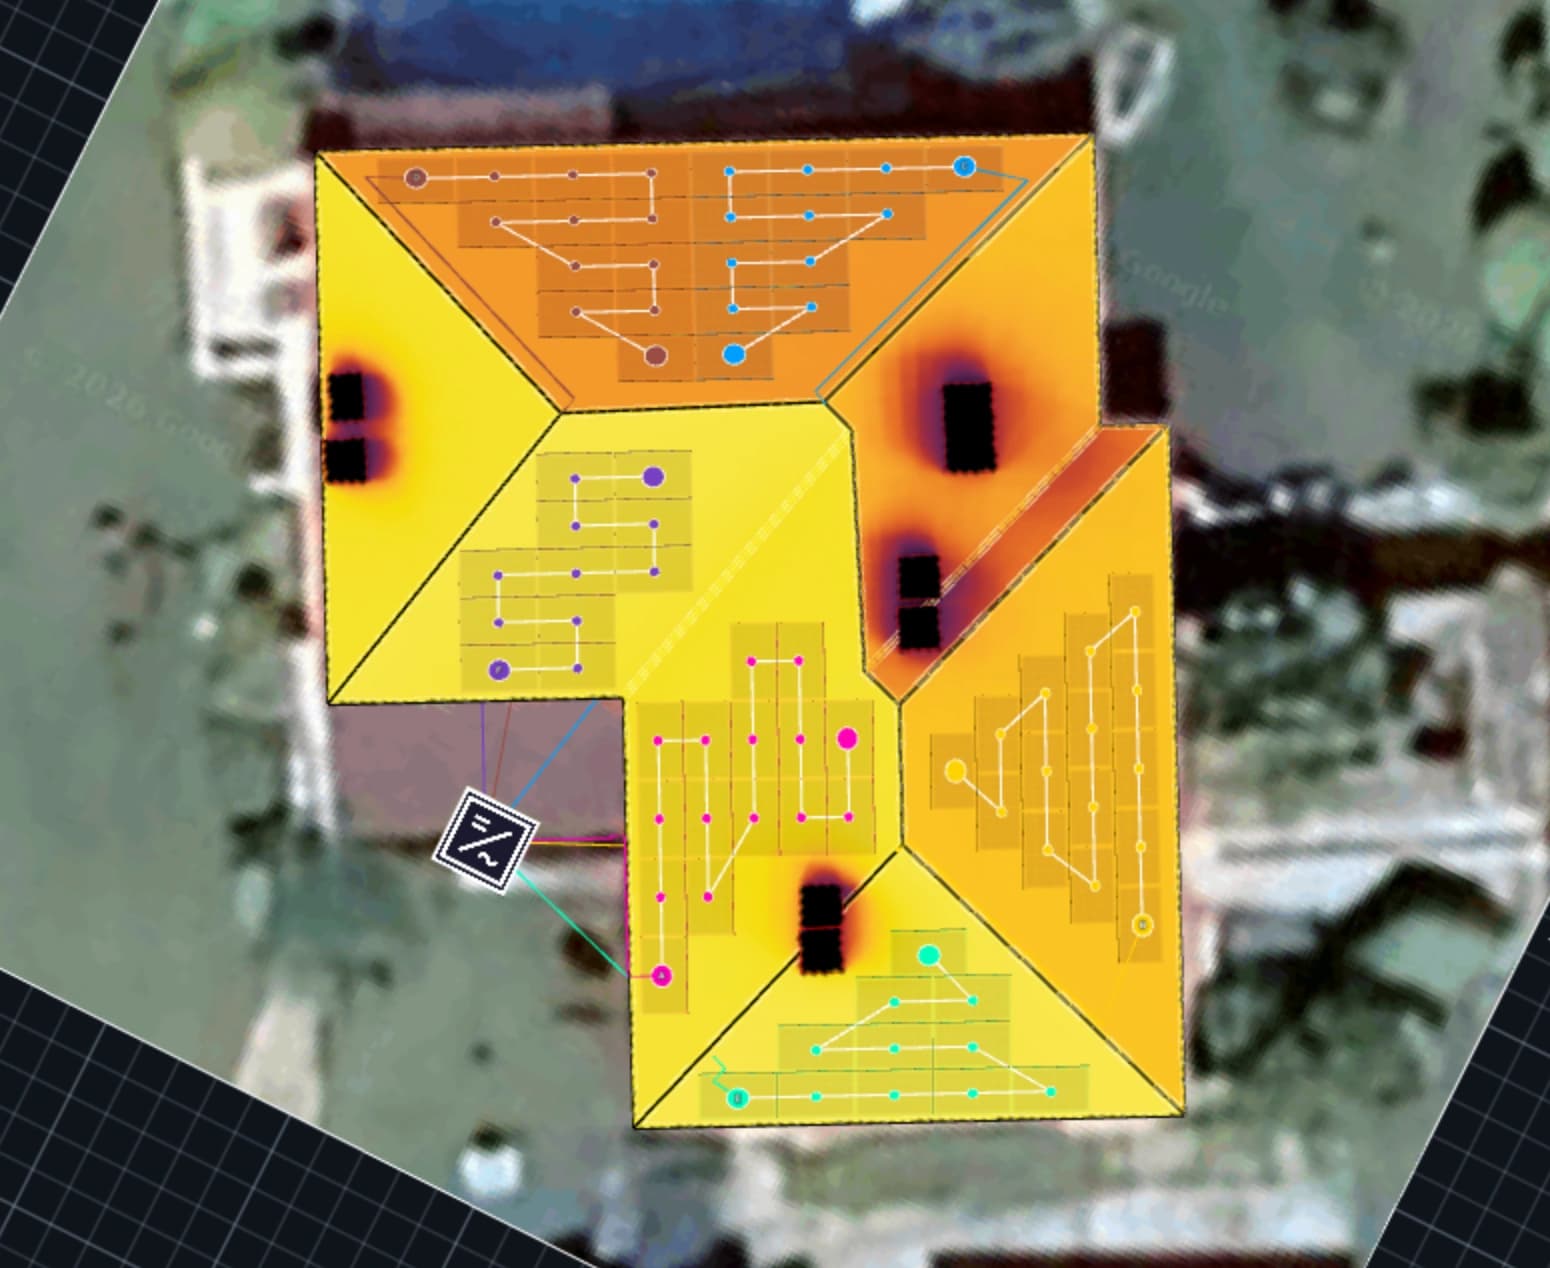
Catch string violations before they become service calls
Stringing mistakes get caught at design time, not on the rooftop. Voc, Vmpp, and Isc validate against inverter limits in real time under worst-case temperatures, and the resulting losses flow straight into the proposal, so the numbers the customer sees are the numbers the system will produce.
- Click or drag to assign panels to strings
- Real-time Voc, Vmpp, Isc per string and per MPPT
- Temperature-dependent worst-case validation
- Stringing loss calculation flows into proposals
- Compare strung output with a power-optimizer scenario
- Run Auto String to build every string in one click, in Full Auto or Guided mode
- Finish the stringing and the single line diagram generates itself
One model for every energy asset your customer wants
Answer "what if we add a battery, a heat pump, an EV charger?" inside the same design, not on a separate spreadsheet. Each new asset re-runs grid export, self-consumption, and financial returns automatically, so payback and CO₂ stay in sync with whatever final mix the customer settles on.
- Battery storage sizing and dispatch
- Heat pump energy demand modeling
- EV charger capacity and load profile
- Cross-component interaction modeling
Design the whole site, not one roof at a time
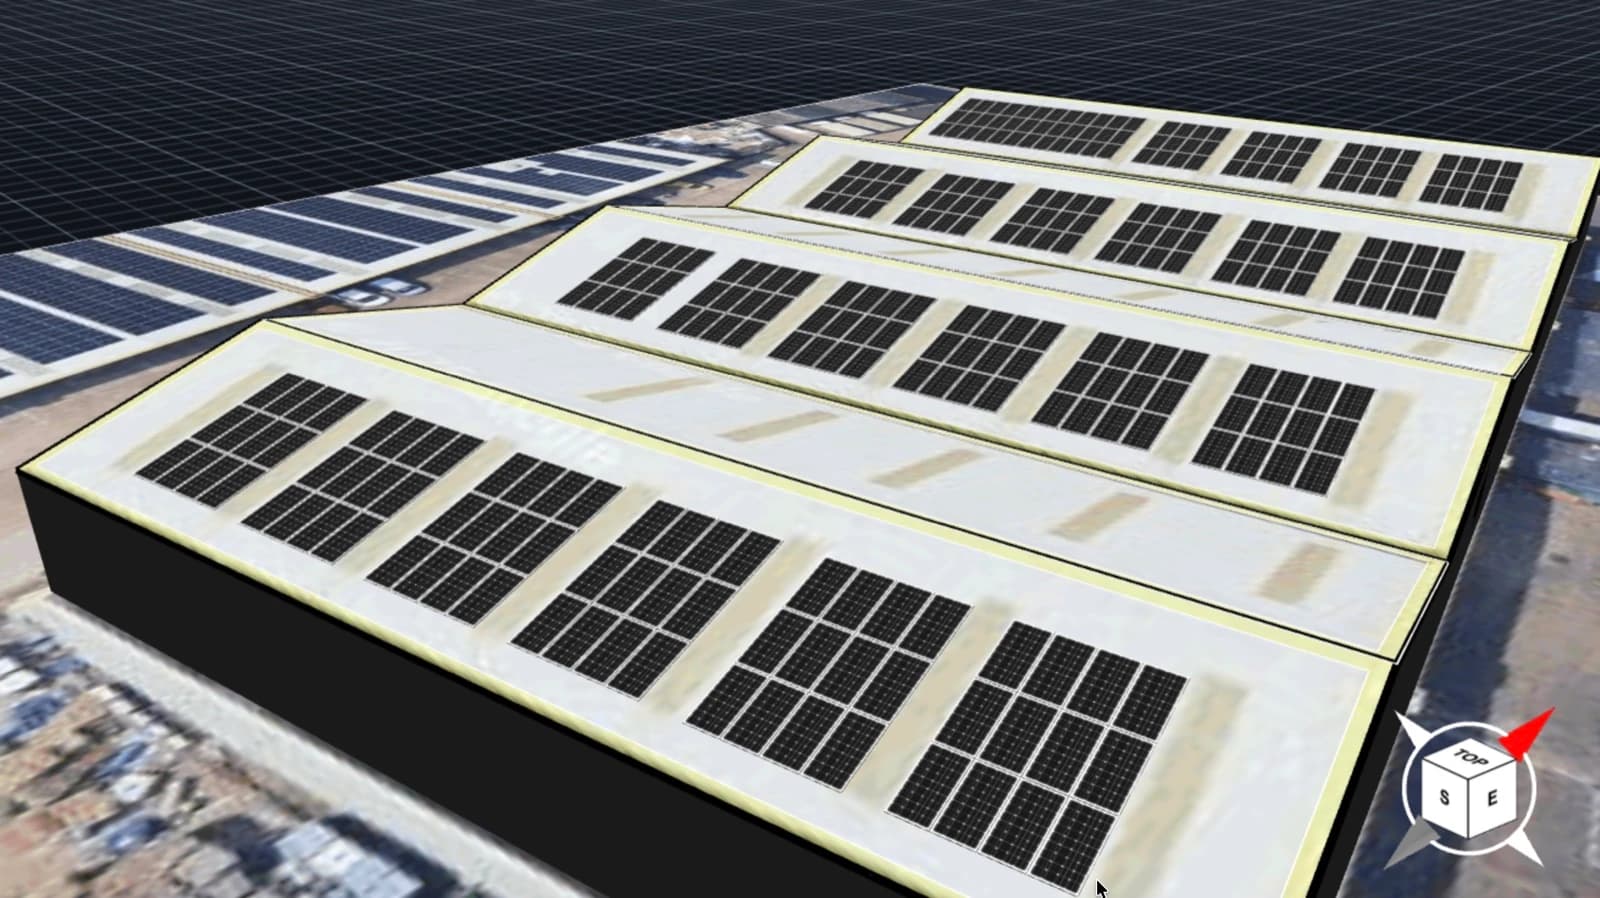
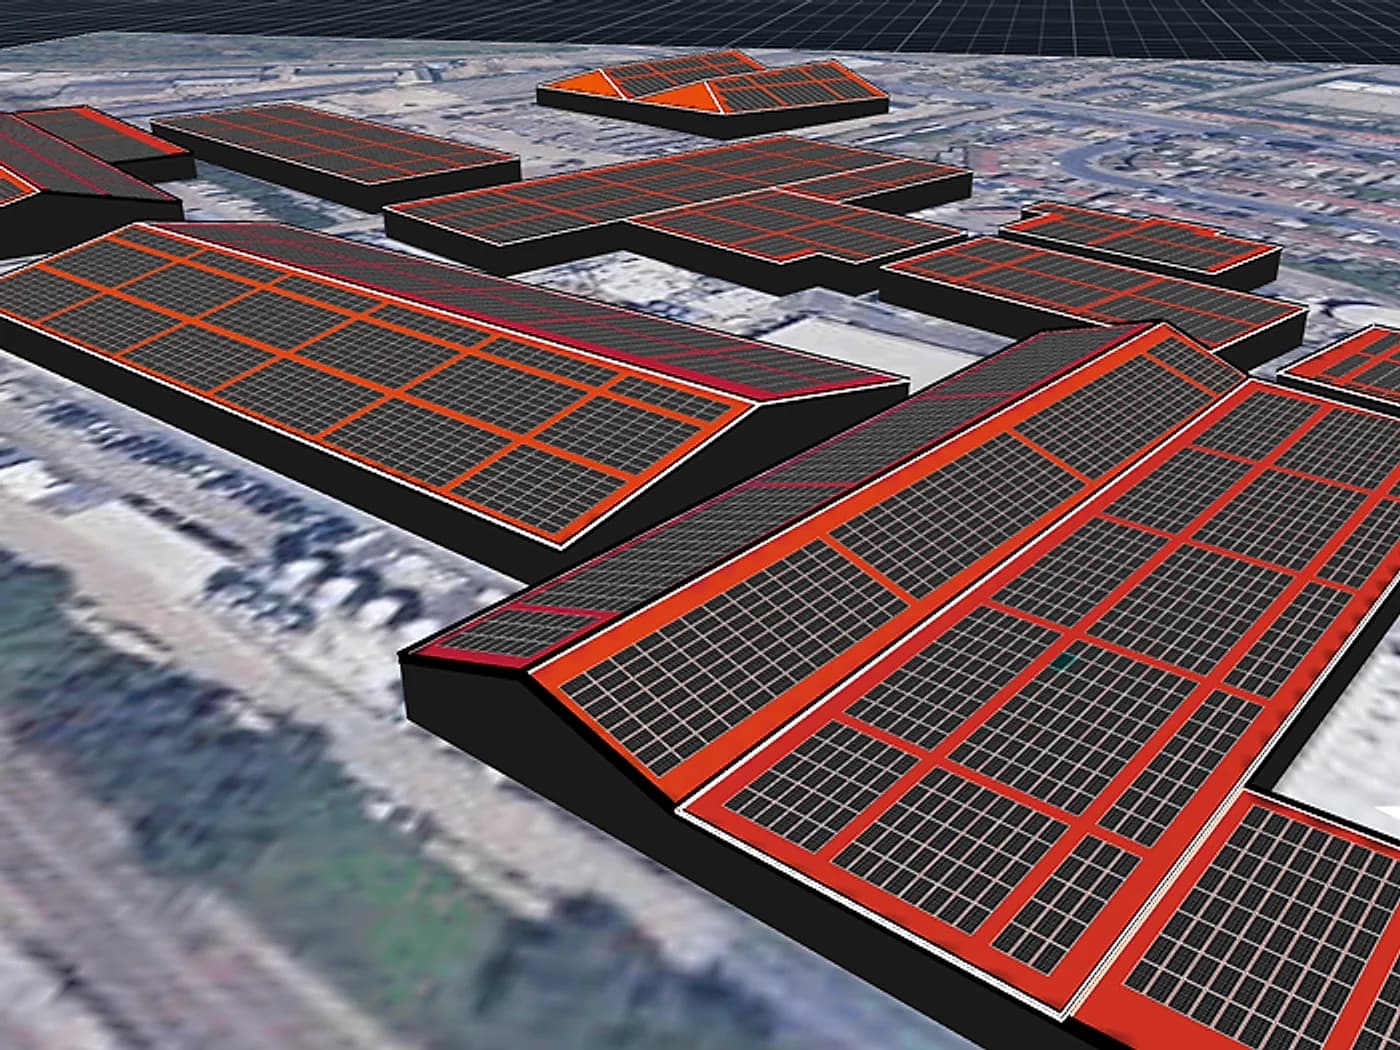
A logistics park is not a house with more panels. Every building on the site is drawn, modeled, and stringed inside one project, while flat-roof racking, service corridors, and wind edge zones come out of the layout engine. Projects run up to 50 MW in a single design, so the capacity you quote is the capacity the site actually holds.
- Every building on the site in one project, with Fit to LiDAR applied to all of them at once
- Flat-roof racking picked automatically: south-facing tilted rows or paired east-west tables
- Service corridors and wind edge zones kept clear on every flat roof
- Panel grouping for repeating geometry, with horizontal and vertical counts per group
- Architectural plans, drone imagery, and site photos aligned as custom base maps
- Projects up to 50 MW, designed and stringed in a single file
- Facades and other vertical surfaces, including BIPV, with their own production estimate
Go deeper into the platform
Single Line Diagram
Generate the single line diagram from your 3D design, with electrical checks built in.
Battery Modeling
Size storage for self-consumption, autonomy or arbitrage on an hourly simulation.
Solar Proposal Generation
Branded solar proposals you can send as a link and track.
Solar Proposal Software
Design, price and sell every solar project in one platform, from roof to proposal.
Questions about 3D solar design
No. The roof drawing tool is designed for solar professionals, not CAD designers. Most users build their first rooftop design within minutes.

