MW-Scale Design, Single Line Diagram, Shade Report
MW-scale placement handles 100,000+ panels, the single line diagram builds itself from your stringing, and a shade report PDF proves the shading.


Built for MW-Scale Projects
Design projects of up to 50 MW and more than 100,000 panels in the same tool you use for rooftops. An extra zoom-out step for non-residential projects and new placement methods fill a whole site with modules smoothly.
Single Line Diagram Editor
The single line diagram is generated from your stringing design, from PV strings and inverters to protection devices, meters and the grid connection. Lay it out on any sheet from A4 to A0, let built-in checks catch voltage or current mismatches, busbar 120% rule violations and unconnected components, then export it as PDF or DXF.
Downloadable Shade Report
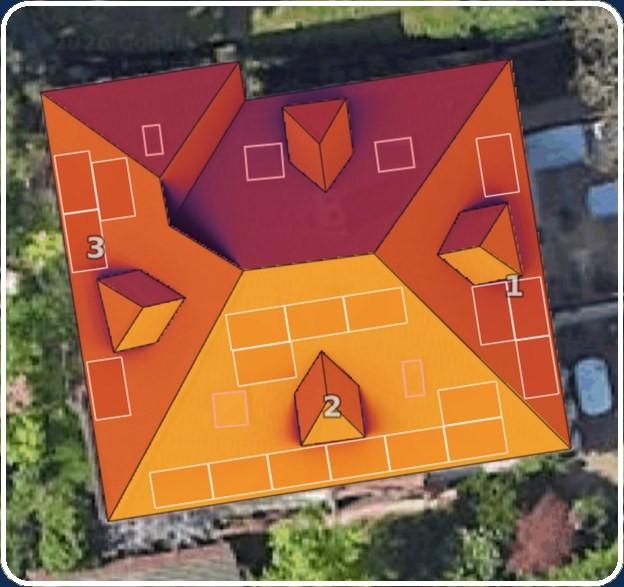
Download a shade report PDF with an Annual Solar Access view, a per-array table of panel count, azimuth, pitch, Solar Access, TOF and TSRF, and a monthly breakdown for each array. Add it to your customer proposal as its own page.
Custom Time Slots in Daily Consumption
With the Custom daily profile you set the time slots yourself: drag them on a 24-hour timeline, go down to one-hour slots, let a slot run past midnight and give each one its share of the day's consumption. Self-consumption and export estimates then fit night shifts, commercial sites and seasonal homes.
Trees as Shading Obstacles
Add trees next to the building while drawing the roof. They do not block panel placement, but their shadows fall on the roof and panels in the shading analysis; adjust the trunk height and canopy size, or copy a tree in one click.
Show Distances & Freer Manual Placement
Hold Option/Alt over a panel to see its distance to nearby panels, roof edges and buildings. Single panels can now go into setback areas or past the roof edge, where the automation stops.
Originally published on: LinkedIn

